How Covid-19 changed the 7 highest margin products of 2020 and 2021

COVID-19 has changed retail forever, and its impact on e-Commerce has created challenges and opportunities to online selling & service no one could have predicted in early 2020.
As outlined in the years past and emphasized during this time, 72% of consumers use mobile devices to shop online, which is very dominant, according to a recent PYMNTS 2020 Remote Payments Study.
E-Commerce supply chains, order management, online websites, and fulfillment services are being tested by the immense demand order and revenue growth today. Looking back at a year of eCommerce changes with the new world of Covid-19, it seems we have blown past all of the predictions made in 2019 to where we are now.
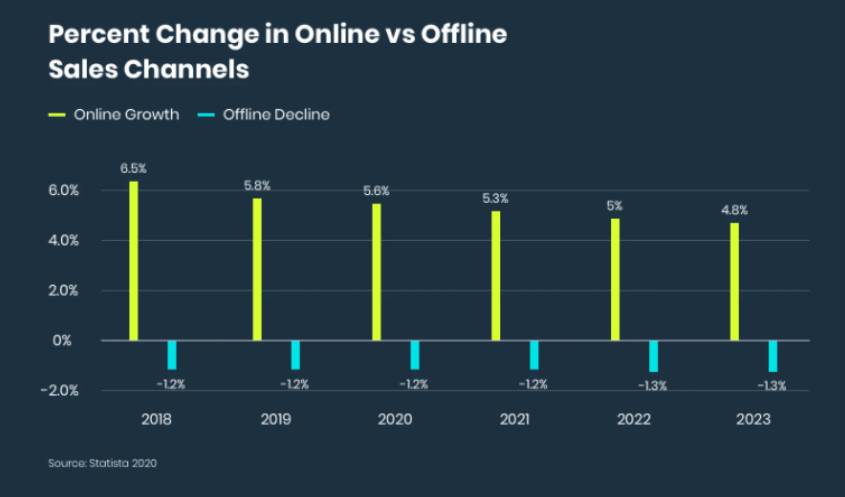
In the US, online retail saw almost 70% YOY growth by the end of April - 2 months of having a global pandemic hit us. Even before the pandemic, the year was setting records by January, with 49% YOY growth than 2019. The pandemic propelled online retail or eCommerce about 5-10 years ahead of time, with people flocking to find supplies online, so they would not be required to leave their home or out of sheer demand of brick and mortar stores selling out of essential goods.
UBS predicts that by 2025, e-commerce will make up 25% of total retail sales, up from 15% in 2019.
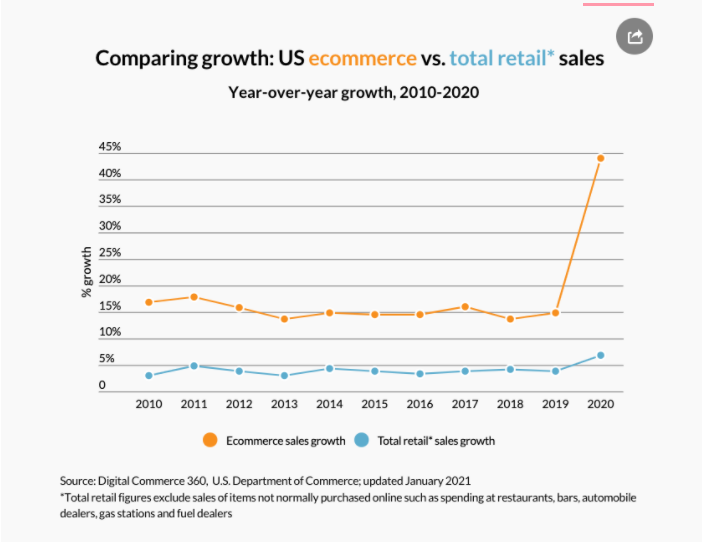
"Consumers spent $861.12 billion online with US merchants in 2020, up an incredible 44.0% year over year. That's the highest annual US e-Commerce growth in at least two decades. It's also nearly triple the 15.1% jump in 2019." - Digital Commerce 360
PriceMole, being a North American Business, also noticed the increase in orders to our partners, especially a few categories of stores that stood out - we will be talking about later in the article.
Taking a look at past Black Friday, we mentioned online conversion rates typically increase from 6-9% on Holidays like Black Friday and Cyber Monday. The pandemic had a similar effect over the last 12 months, increasing online conversion by 8-15%, according to QuantumMetric.
Covid 19 forced hundreds of thousands out of business. But for some companies, COVID 19 spelled OPPORTUNITY.
Amazon reported that as early as May of 2020, their sales had doubled compared to 2019. This statistic is incredible when taking a look at Amazon's sales in 2018 and 2019
According to Oberlo, Millions of SMBs (small and medium-sized businesses) worldwide are working with Amazon. On average, SMBs located in the US sell more than 4000 items per minute.
Amazon also has a complicated pricing model. The company is a pioneer in dynamic pricing and makes over 250 million price changes every day. The average product's price will change once every 10 minutes, making it difficult for sellers and consumers to keep up.
Over the last ten years, Amazon has become one of the most powerful, respected, and feared companies in tech and well beyond.
Revenue from eCommerce has increased sevenfold from an already massive base of $34.2 billion. Yet Amazon still has only 40% of the overall e-commerce market in the US, according to eMarketer, and far less worldwide, leaving plenty more upside. Walmart currently trails Amazon by 7%.
In April, the Wall Street Journal reported that Amazon had been using data from third-party sellers to determine which items were selling well, then making private-label versions of the same products to compete with the sellers' products. (Amazon said such a practice would violate its policies, and it vowed to investigate.)
Beyond the morals in this debate, if Amazon is tracking all of us, from the Consumer - to show them accurate ads based on interest and previous searches - to retailers - to learn about shopping trends, pricing and demand, how can smaller retailers keep up without tracking Amazon?
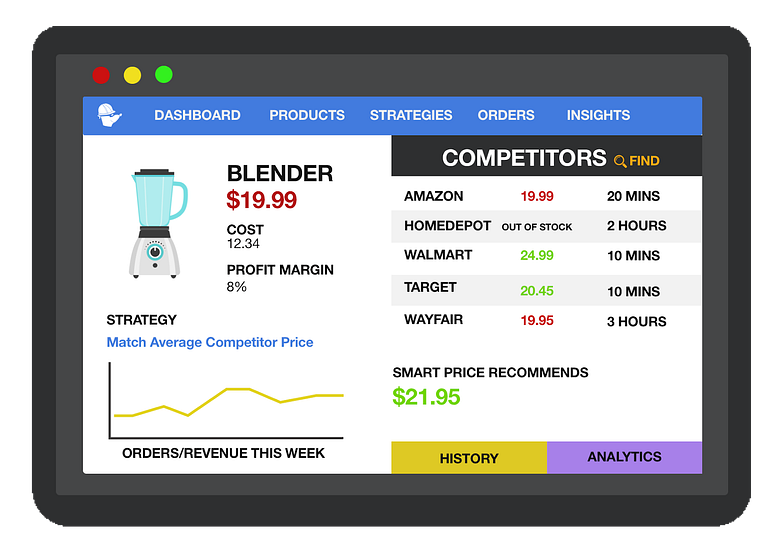
PriceMole tracks Amazon around the clock. Considering the data from the last 12 months, how does the overall market performance coincide with Amazon's performance?
Here are the highest margin products of 2020 and 2021 during Covid 19
7.Kitchen Appliances
25-35% Markups
Highest Sales Category of 2020

Kitchen Appliances was and are the top-selling category of the pandemic, not just on Amazon but across all eCommerce sales.
Although the markup is not the highest, where you make up the lower profit margin is the sheer volume of sales happening. When a dishwasher breaks down or the washing machine leaks all over, people don't usually want to wait more than 24-48 hours for a new one. So if you have stock, you will sell! People spending all this additional time at home drives the necessity of having all necessary appliances functioning well.
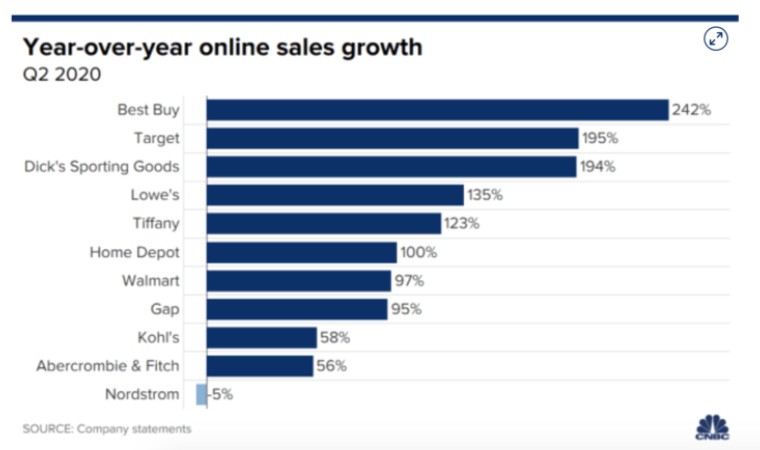
In the US, Best Buy's eCommerce sales increased by 242% in the second quarter vs. 2019.
Target's sales were up to a new record all around due to increased demand for same-day services. Offering BOPIS increased eCommerce Sales by more than 60, and offering Curbside pickup had the most impressive results, increasing by more than 700% in Q2 and Q3, according to indigo9digital.
In Canada, top retailers like Leon's and The Brick grew five-fold during Q4. According to research from Home Goods Online, revenue totals $830.9 million, up 10.6% from 2019.
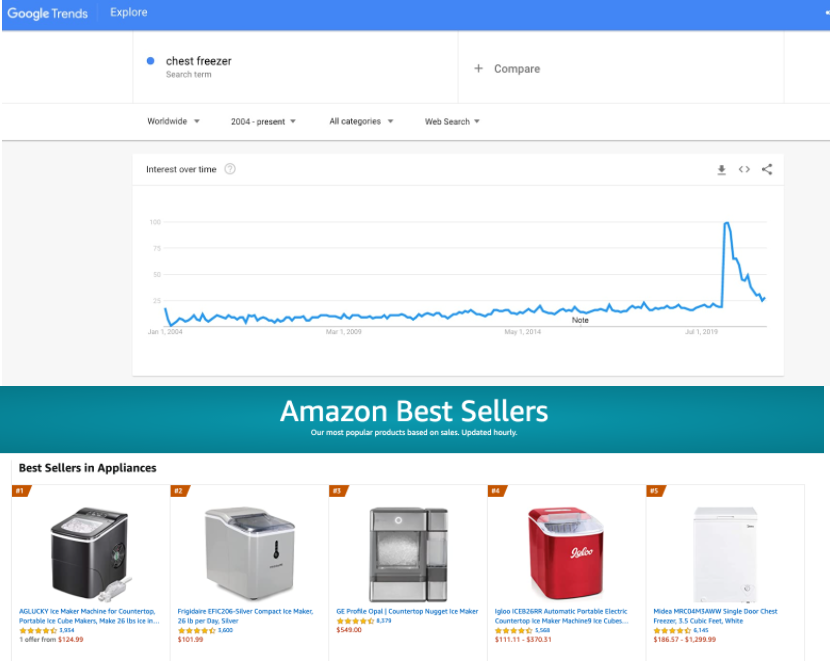
Trends during the Pandemic included Chest Freezers and IceMakers.
Top products: Washers, Dryers, Dishwashers, Refrigerators, Oven/stove/cooktops
Top Sellers Amazon: Ice Maker, Mini Freezer, Portable Washing Machine
Top Brands: Maytag, KitchenAid, Miele, Whirlpool, Frigidaire, Bosch, GE
Top Shopify Stores: ooni.com, misen.com, breeo.co
6.Pet Products
50-80% Markups
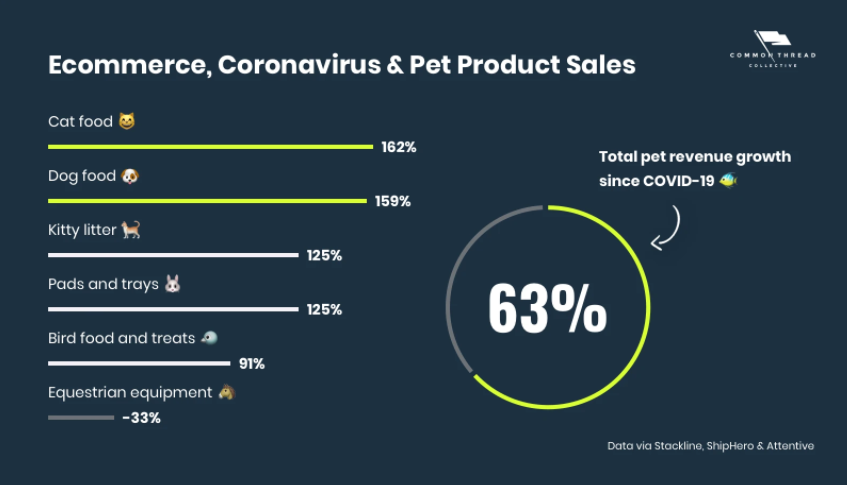
According to the 2019-2020 APPA National Pet Owners Survey, 67% of US households own a pet, which equates to 84.9 million homes. In 2020, consumers spent $103.6 billion on pets in the US.
According to Statistica, the pet store industry continues to grow despite increased competition from supermarkets, mass merchandisers, and online retailers that offer convenience at lower prices. The main reason seems to be that people care more about their pets than the price they are willing to pay and the convenience of acquiring these goods.
The pet industry seems recession-proof and predictable; people will always need to shop for their pets. Besides the significant profit margins, there is no need to educate consumers. Dog owners spend an average of around $1,641 and cat owners approximately $1,125 per year, from necessities like food to toys and treats and even designer collars!

So what are the most prominent opportunities during this time? We took a look at the Canadian Pet Market Survey 2020 that indicates we are spending during COVID-19 due to:
- New Pet Ownership
- Researching Freshness, Sustainability as the New Superpremiums
- Looking to Source Local as the New Natural
- Learning to Expand Pet Food Manufacturing Capacity
Top Products: Dog Baggies, Pet Bed, Cat Litter, Portable Pet or Baby Gate
Top retail stores: PetSmart, PetCo
Top Shopify stores: westandwillow.com, pawhuggies.com, headsupfortails.com, crownandpaw.com
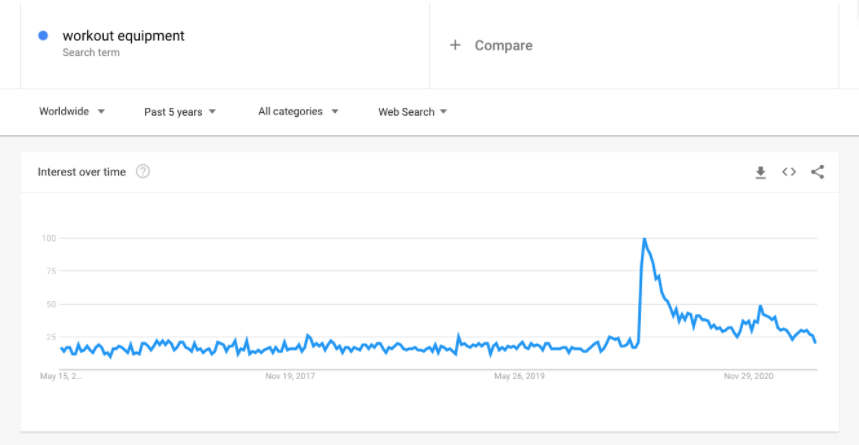
5.Gym and Sports equipment
20-30% average Markup
120% Markup during Pandemic - Resellers Markup up to 600%
"What this pandemic has revealed is that taking care and control of your own health — individual, family, home, etc. — is even more critical than before. "- Wendy Liebmann, CEO, WSL Strategic Retail
Despite 2020 being a punishing year for gyms, COVID-19 has reshaped the landscape of fitness and has led to the industry skyrocketing.
Home gym equipment sales have spiked by a massive 5813% in 2020
- Steppers (+6,500%)
- Weight benches (+4,130%)
- Exercise bikes (+2,113%)
- Weights (+1,743%)
- Yoga and Pilates equipment (+1,269%) (Yahoo Finance)
In addition, Fitness App Downloads and Subscriptions soar.
According to a study from the Washington Post,
- Home Workout — No Equipment, was downloaded 43.5 million times, more than doubling its installs from 2019
- Strava, the GPS running, and cycling app, was downloaded more than 20 million times, a 120% increase from 2019
The global home gym equipment market has seen an increased level of competition due to a highly fragmented presence of international and local vendors. Vendors in North America have ramped up the implementation of online platforms and websites for retail. Demand allowed these Retailers to implement Pre Sales of all types of Gym equipment before it even being fabricated across the ocean due to the increased demand.
Top retailers: Technogym, Nautilus, Dyaco
Top Amazon products: Waist Trainer, Resistance Bands, Jump Rope
Top Shopify Retailers: tammyhembrow.org, fujimats.com, shopworldgym.com, xbar.com
4. Consumer Electronics
60-100% average Markups (Huge drop from 2018)

US eCommerce sales of computer and consumer electronics total $156.50 Billion in 2020 —and nearly half of all products sold in this category overall (49.5%) will be purchased online, based on eMarketer.
In 2021, consumers are still spending a majority of their time at home. CTA expects spending on software and streaming services to grow 11% this year to $112 billion (15% increase video streaming to $41 billion spent, 19% growth in audio streaming to $10 billion, and 8% growth sales of video games to $47 billion).
Laptop sales surged in 2020, as the COVID-19 crisis speeds up the adoption of various technologies as people work and learn remotely and spend more time at home. The same goes for Television sales as consumers shifted to larger models and 8K ultra-high-definition TVs. Sales are projected to increase 300% to 1.7 million units in 2021.
Apple took advantage of the pandemic and revolutionized the industry with its new M1 chip. The Apple M1 is an ARM-based system on a chip designed by Apple Inc. It is a central processing unit and graphics processing unit for its Macintosh products that offered high-performance and high-efficiency and a drop in price across the board. This innovation caused a dip in margins across the industry - but not in sales! Consumer Electronics was the second-largest sales category during the pandemic.

In addition, thanks to Apple Airpods, and similar wireless headphones, earbuds outsold wired headphones for the first time in 2020. According to CTA, For 2021, Wireless earbuds are expected to grow 32% to 91 million units in 2021, with revenue up 16% to $9.3 billion.
And Continuing to talk about Apple, we recorded a 6% growth in health and fitness electronics, driven by fitness trackers and smartwatches, to $9 billion.
Given the hands-free nature of Alexa, hospitals are adopting Alexa as a communication tool. Northwell Hospital in New York added 4,000 Echo Show devices to allow staff to speak with COVID-19 patients in isolation. In many ways, Alexa acts as a search engine but without the need for an extra device.
The Graphics Card (Video Card) market revenue was 16 Million USD in 2019 and will reach 18 Million USD in 2022, with a CAGR of 1.24% during 2020-2025, according to Industry Research.
Due to Covid-19, the manufacturing of chips and other hardware was limited. Not to mention shipping delays, and increased demand for at-home gamers, and increasing interest in Bitcoin mining, caused the demand to heavily outweigh the supply and a skyrocket in a price increase. Experts do not expect the industry to keep up with demand over the next 5 years.
Opportunities:
- Privacy and Safety for the Consumer
- Portable and Compact
- Affordability
- Chip Manufacturers
Top products: laptops, mobile phones, TVs, Consoles, Headphones
Top Sellers Amazon: Streaming Stick, Smart Home Hub, Apple Airtags, Security Camera
Top Brands: Apple, Toshiba, LG Electronics, Sony, Hitachi, Samsung, Phillips
Top Shopify Stores: www.staples.ca, www.nativeunion.com, www.boat-lifestyle.com
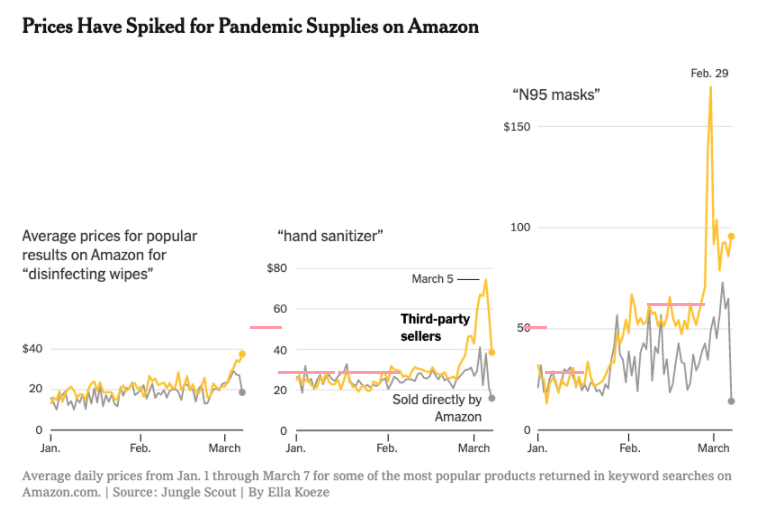
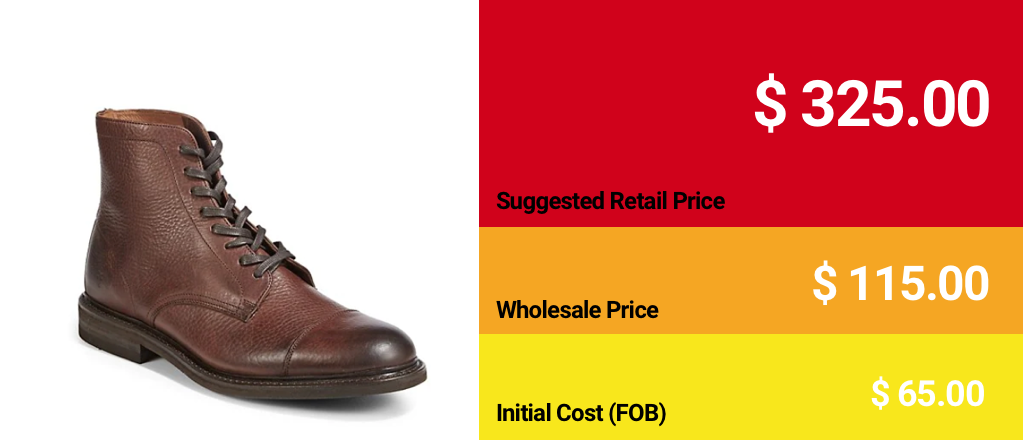
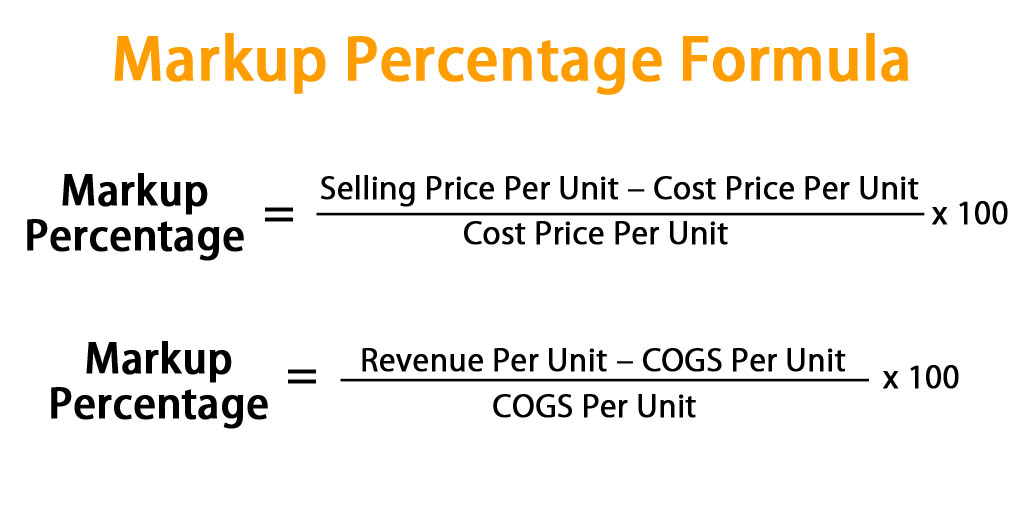
60-100% markup - up to 700% Markup for Luxury brands Are you working from home today? Check—no need to do my hair and makeup today. Are you going out today? Check—no need to do my hair and makeup today. Just grab my mask! 2020 US beauty sales totaled $16.1 billion in 2020, per NPD, a 19% drop from 2019. However, quickly recovering in 2021 — and with an annual compounded growth rate of 4.75% worldwide — it's predicted to exceed $716B by 2025. And $784.6B by 2027, based on Research from Common Thread Co. By geography, the Asia Pacific and North America dominated, accounting for more than 60% of the total market combined. "E-commerce beauty sales grew by 200% year-over-year in 2020." - Larissa Jensen of NPD Group, at CEW's annual market trend briefing in New York City—Global Cosmetic Industry 2020 Consumers' shifted to self-care, small luxuries, and digital shopping channels. Per NPD, US prestige beauty e-commerce sales jumped 46% in 2020, a 30% YOY growth. Nail polish sales grew 37.5% YOY from 2019. Haircare sales totaled $197.2 million, a decline of 10% from 2019, fueled by a 95% YOY rise in e-commerce sales. Although eCommerce penetration has only increased slightly in recent years, the beauty and personal care online share is predicted to surge to 48% in the United States by 2023. Opportunities in 2020 Pandemic Related Facts The most exciting developments in the pandemic panic caused hoarding and price gauging of essential personal hygiene products from toilet paper, hand sanitizer to wipes and masks. According to Dr. Ronalds Gozales, an Assistant professor in the Department of Forest Biomaterials, more than 99% of tissue products are manufactured in the united states. However, grocery stores usually only keep a few weeks' worths of essential goods like toilet paper in their warehouses, the sudden surge ins sales — primarily fueled by panic-buying and hoarding — has quickly depleted stocks. Although empty shelves have since long been restocked, the new mid-pandemic Consumer is experiencing nervousness and buying more. Those who can afford it or know how to budget are still buying in bulk. However, during the shortage of toilet paper, there was no shortage of opportunists. Some people sold rolls of toilet paper for up to $100 on eBay or Craigslist. Even larger retailers like Amazon and Walmart had to take steps to minimize or eliminate price gauging when 200ml Hand Sanitizer Listings started appearing for $20+! The same happened initially with the lack of masks that were available for sale as masks became mandatory. We are still seeing a shortage of N95 masks today. Top products: nail polish, at-home hair care kits, beard oil, skincare Top Sellers Amazon: masks, face massage tool, heat protectant spray, q-tips, lotion Top Brands: L'Oréal, Unilever, Procter & Gamble Co. , The Estee Lauder Companies, Shiseido Company, and Lancôme Top Shopify Stores: colourpop.com, skinnydiplondon.com, sokoglam.com, luxskin.co 200-400% average Markups (some items up to 900%) "Home furnishings [sales] continues to be up over 120% year-over-year, but we're seeing different kinds of items; what we're seeing even in October now, is things are good for outdoor gatherings, blankets or fire pits." - Etsy CEO Josh Silverman at the end of Q3 2020 from and Interview with Yahoo Finance During the last 12 months, we saw an increase of 47% in online home decor sales and a record-breaking 89% increase in eCommerce furniture sales compared to 2019, according to Salesforce. Given the age-old industry of brick and mortar furniture sales, the pandemic has amounted to 69% of retailers focusing their efforts towards a new eCommerce retail avenue based on research from Furniture Today. Comparing sales from various eCommerce platforms and large online retailers, the top-selling furniture categories in the last 12 months include: In addition to items that sell well, there are a few tech advancements that let some stores move ahead during the pandemic: The highest increase in sales in the US in 2020 for the furniture industry was in April, with 79% in Nationwide sales. In January of 2021, sales decreased by 3.8%, according to Statistica. However, during the pandemic, we also saw many closures of brick and mortar stores in this category due to retail giants not being able to pivot towards online retail fast enough. According to UBS, 11,280 home furnishings stores are expected to close by 2025. Top Sellers on Amazon: Laptop stands, Printer cartridges, desks Top Furniture retailers: Ashley Home Store, IKEA, Williams Sonoma Top Shopify stores: staples.ca, ruggable.com, brooklinen.com, pier1.com 220-250% Markups - Up to 800% Markup The global fashion industry's profit was expected to fall during the pandemic due to people staying home most of the time and not shopping around the clock. Despite seeing a drop in Global Sales, Clothing still has one of the most profitable markups. After a year in which the fashion industry posted record-low profits, business leaders are seeking to innovate during this new normal. The global fashion industry is projected to grow in value from 1.5 trillion U.S. dollars in 2020 by 2025, according to Statistica. The Asia Pacific is currently the largest contributor to growth at 4%. The world's largest apparel markets include the United States, China, and Japan. But some rise to the occasion, performing exceptionally due to these key characteristics: According to McKinsey, Given the standout performance of digital channels in the current environment, Digital channels will remain king in 2021; gone are the days of spending Saturday afternoon at the mall. A full recovery of global fashion sales to pre-crisis levels will not come until the third quarter of 2022 at the earliest. Top products: Loungewear, Slippers, Activewear, FaceMarks, Sneakers, Pajamas Top Sellers Amazon: Crocs, Levi Skinny Jeans, Men's Boxers Top Brands: Nike, Gucci, Adidas, Louis Vuitton, Cartier, Zara, H&M Top Shopify Stores: www.cettire.com, www.fashionnova.com, www.gymshark.com, zanerobe.com Fresh-food meal kits Meal kit revenue is expected to grow to over 11.6 billion US dollars in 2022. An expected more than double increase from 2017. This industry was valued at 4.65 billion us dollars, representing 300 percent growth over the previous year. Fresh-food meal kits hit the sweet spot with consumers. According to Statistica, as people try to avoid shopping in-store due to in 2020, online meal kit delivery services have a chance to increase their market penetration, moving into the digital domain steadily. With fresh-food meal kits, services deliver ingredients with easy-to-follow recipes straight to the doorstep. In a recent survey, three of the top four reasons for using meal kits according to consumers centered around convenience. Leading players: Eat2Explore, Blue Apron, and HelloFresh College tuition, classes, textbooks Long before the pandemic, college costs were considered outrageous in the US. According to BrokeScholar, the average cost of tuition and fees — in inflation-adjusted dollars — at private and public schools has more than tripled from 1971-72 to 2019-2020. According to Forbes, the costs of attending college or university have been unfavorable for decades. Adding to these concerns, the coronavirus pandemic admission and tuition fees feel out of control and abusive. For example, the average cost for an in-person Calculus 1 course in the US is $2,500, compared to $400 for the online equivalent, according to Outlier. However, no tuitions are being refunded amidst the pandemic and school closures. Gaming According to the market research firm NPD Group, gaming sales in the US in 2020 increased 37% year-over-year to $3.3 billion. As of mid-2020, sales in the US of video games continue to surge, and experts are placing bets if this will continue over the years to follow as restrictions loosen. With more people cooped up inside in 2020, consumers turned to gaming to help them pass the time during the pandemic. Whether that gaming was on consoles, PCs, or mobile devices, sales were up. According to Quartz, by August 2020, $29.4 billion video games had been sold in the US, up 23% from the year before. Nintendo, like many other video game companies, experienced soaring profits which reported $1.4 billion in earnings in Q2—five times more than 2019. Thanks to the social simulation game Animal Crossing: New Horizons, which became immensely popular worldwide in Q2 2020. Call of Duty: Warzone, a first-person shooter "battle royale," sales have multiplied during the pandemic. According to its publisher, Activision, the game had 75 million active players in August, up from 30 million in late March. So having reviewed the highest margin products of 2020 and 2021 during Covid, How do Markups work, and how are they calculated? Brock is the owner of a company that specializes in the manufacturing of office chairs. He recently received a large order from a company for 30 chairs. The cost per chair is $500. Delivery would cost $50 per chair. If Brock wants to earn a 20% profit, what price does he need to charge? Step 1: Calculate the total cost of the order (chairs + delivery). $500 x 30 + $50 x 30 = $16,500 (total cost). Step 2: Calculate the selling price by using the desired percentage of 20%. 20% = (Selling Price – $16,500) divided by the cost $16,500 therefore Selling price must be: $19,800 (selling price). Therefore, for Brock to achieve the desired markup percentage of 20%, Brock would need to charge the company $$19,800 total, or $660 per chair. Have any questions, comments, ideas? Think we missed a high-margin product category? We look forward to hearing from you! Want to learn more about Competitor Price Tracking with PriceMole? Learn more on our Website, Shopify, Facebook, Linkedin, and Twitter.3.Beauty & Personal Healthcare


2.Home office decor and furniture

![]()
1. Fashion

Special mentions:![]()

![]()
So Now, What are the next steps for your retail store?